The Configuration File
The report configuration files contain all of the overall configuration for each of the report pages, and are stored in the folder src/configurations. Here you can control how a report page will appear, including the resources and fields it displays, which metrics are displayed in the graph, whether there are separate tabs for different groups of data, and the journey the client can take as they drill down through the different dimensions.
It is often useful to copy the configuration from an already established report page, then edit it as required.
Configuration Properties
Property |
Description |
|---|---|
pageTitle |
This will be the title of the report that appears on the top left of the layout inside the top bar. |
dateDimension |
Here you can specify which field to use for the date axis of the graph. |
resources |
This is an array that contains all the resources that will be displayed in the table and breadcrumbs of this report. |
showDropdownLegend |
Optional - set it to 'true' if you want to display multiple metrics in the graph. |
chart |
This contains general configuration for the graph. |
chart: chartType |
ChartType will be the default chart on load. |
chart: allowedChartTypes |
This will determine which chart options are allowed on a config. allowedChartTypes is used to display chart button options. There is a allChartTypesWithLine/allChartTypesWithAreaSpline in chart-types.js. If you do not need to use allChartTypesWithLine/ allChartTypesWithAreaSpline, you can create a array similar to allChartTypesWithLine/allChartTypesWithAreaSpline with the chart types you need. |
chart: chartId |
Choose a unique ID for the graph. This is used as a reference by the chart component. |
chart: allYMetrics |
This is an array that contains all the metrics you want to appear in the y-axis of the graph. |
chart: allXMetrics |
Optional - if your report requires multiple metrics on the x-axis of the graph. |
chart: initialYMetrics |
Here you can specify which metric(s) to display as default in the graph y-axis. This will usually be a single metric, but must still be contained within an array. If you want to display multiple metrics in the graph, be sure to set showDropdownLegend to 'true' in your configuration. |
chart: initialXMetric |
Optional specify which metric should be displayed by default in the graph x-axis. |
chart: options |
Optional, add a options to the config when you would like to add a unique highcharts config to a specific config. |
chart: selectionLimit |
Optional, add a selectionLimit to the config when you would like to add a unique selectionLimit to a specific config. |
table |
This object contains configuration specifically for the table. The possible properties are explained below. |
table: tablistitems |
Here you can define tabs which can contain individual tables to display various groups of data. See the below example which defines four tabs, the title of each tab and the fields that will be displayed in the table beneath each tab: |
table: fieldChildren |
If you want to display more than one resource within a report page, here you can define the 'journey' a client will take as they click through each dimension. In the example below, when the table is displaying the referer (or 'Channel Name') as the dimension, each referer (or channel) has it's own specified resource (and dimension field) to display next when the dimension is clicked. |
Example - Tabs
{
    tabName: 'traffic',
    displayName: 'Traffic',
    isSelected: true,
    metrics: [fields.ACTUAL_TRAFFIC, fields.INCREMENTAL_TRAFFIC, fields.ATL_TRAFFIC_PROPORTION],
},
{
    tabName: 'sales',
    displayName: 'Sales',
    metrics: [fields.INCREMENTAL_LC_SALES_ATL, fields.INCREMENTAL_FM_SALES_ATL, fields.ACTUAL_LC_SALES, fields.ATL_LC_SALES_PROPORTION, fields.ATL_FM_SALES_PROPORTION, fields.SALES_VARIANCE, fields.SALES_VARIANCE_PCT],
},
{
    tabName: 'revenue',
    displayName: 'Revenue',
    metrics: [fields.INCREMENTAL_LC_REVENUE_ATL, fields.INCREMENTAL_FM_REVENUE_ATL, fields.ACTUAL_LC_REVENUE, fields.ATL_LC_REVENUE_PROPORTION, fields.ATL_FM_REVENUE_PROPORTION, fields.REVENUE_VARIANCE, fields.REVENUE_VARIANCE_PCT],
},
{
    tabName: 'all',
    displayName: 'All',
    metrics: [fields.ACTUAL_TRAFFIC, fields.INCREMENTAL_TRAFFIC, fields.ATL_TRAFFIC_PROPORTION, fields.ACTUAL_LC_SALES, fields.INCREMENTAL_LC_SALES_ATL, fields.INCREMENTAL_FM_SALES_ATL, fields.ATL_LC_SALES_PROPORTION, fields.ATL_FM_SALES_PROPORTION, fields.SALES_VARIANCE, fields.SALES_VARIANCE_PCT, fields.ACTUAL_LC_REVENUE, fields.INCREMENTAL_LC_REVENUE_ATL, fields.INCREMENTAL_FM_REVENUE_ATL, fields.ATL_LC_REVENUE_PROPORTION, fields.ATL_LC_REVENUE_PROPORTION, fields.REVENUE_VARIANCE, fields.REVENUE_VARIANCE_PCT],
}
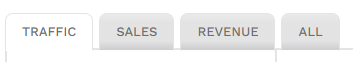
The resulting tabs from the tab configuration above.
Example - Field Children
fieldChildren: {
    "referer": {
        "default": [{
            resource: resources.REPORT_MCS_REFERRER,
            field: fields.REFERRER_DOMAIN,
        }],
        "PPC": [{
            resource: resources.REPORT_MCS_PPC,
            field: fields.PPC_CAMPAIGN_NAME,
        }],
        "SEO": [{
            resource: resources.REPORT_MCS_LANDING,
            field: fields.LANDING_HOST,
        }],
        "Direct": [{
            resource: resources.REPORT_MCS_LANDING,
            field: fields.LANDING_HOST
        }],
        "Email": [{
            resource: resources.REPORT_MCS_UTM,
            field: fields.UTM_SOURCE
        }],
        "Shopping": [{
            resource: resources.REPORT_MCS_SHOPPING,
            field: fields.SHOPPING_CAMPAIGN_NAME
        }],
    },