Grafana
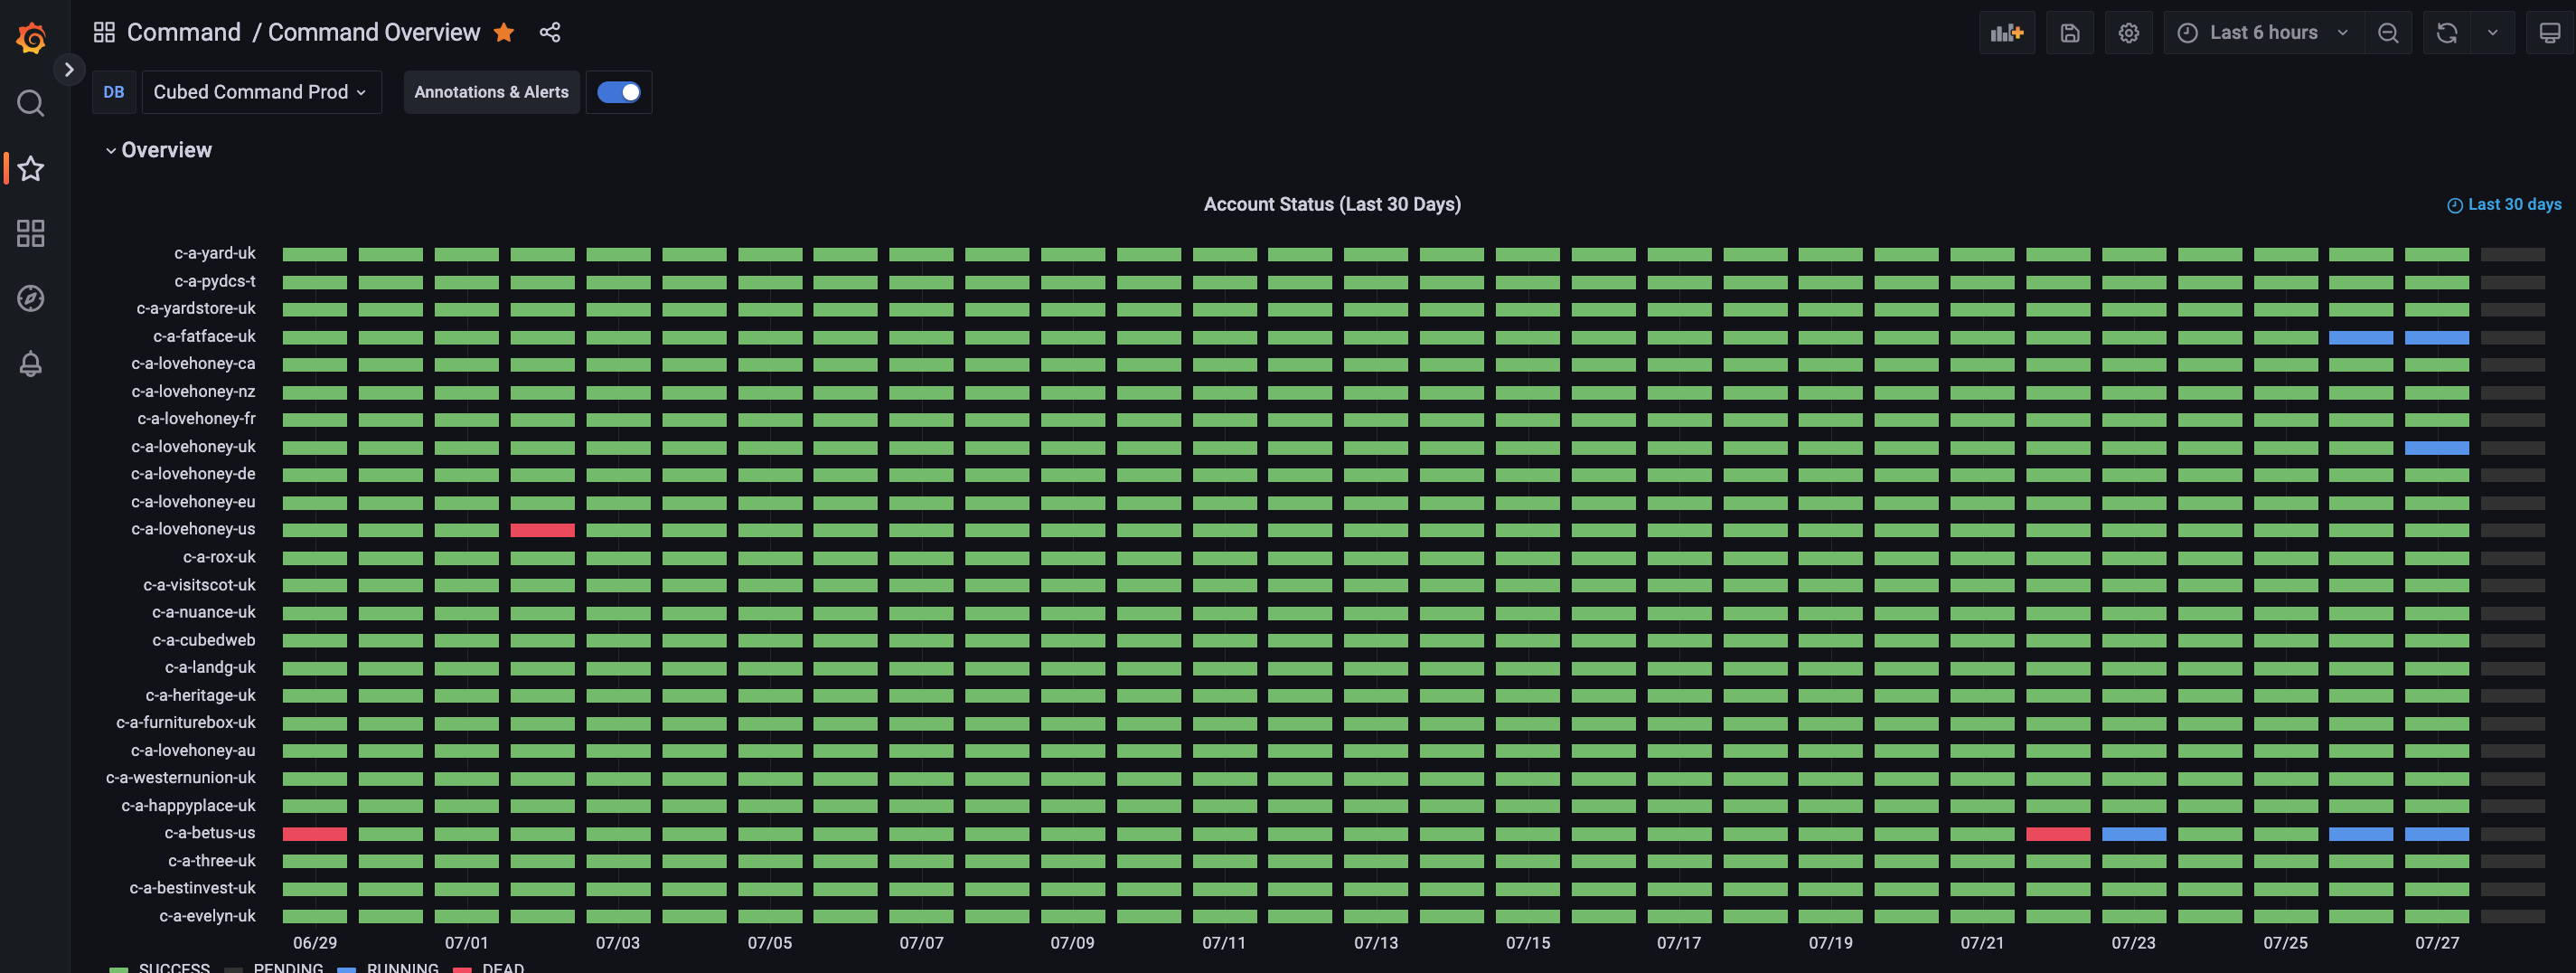
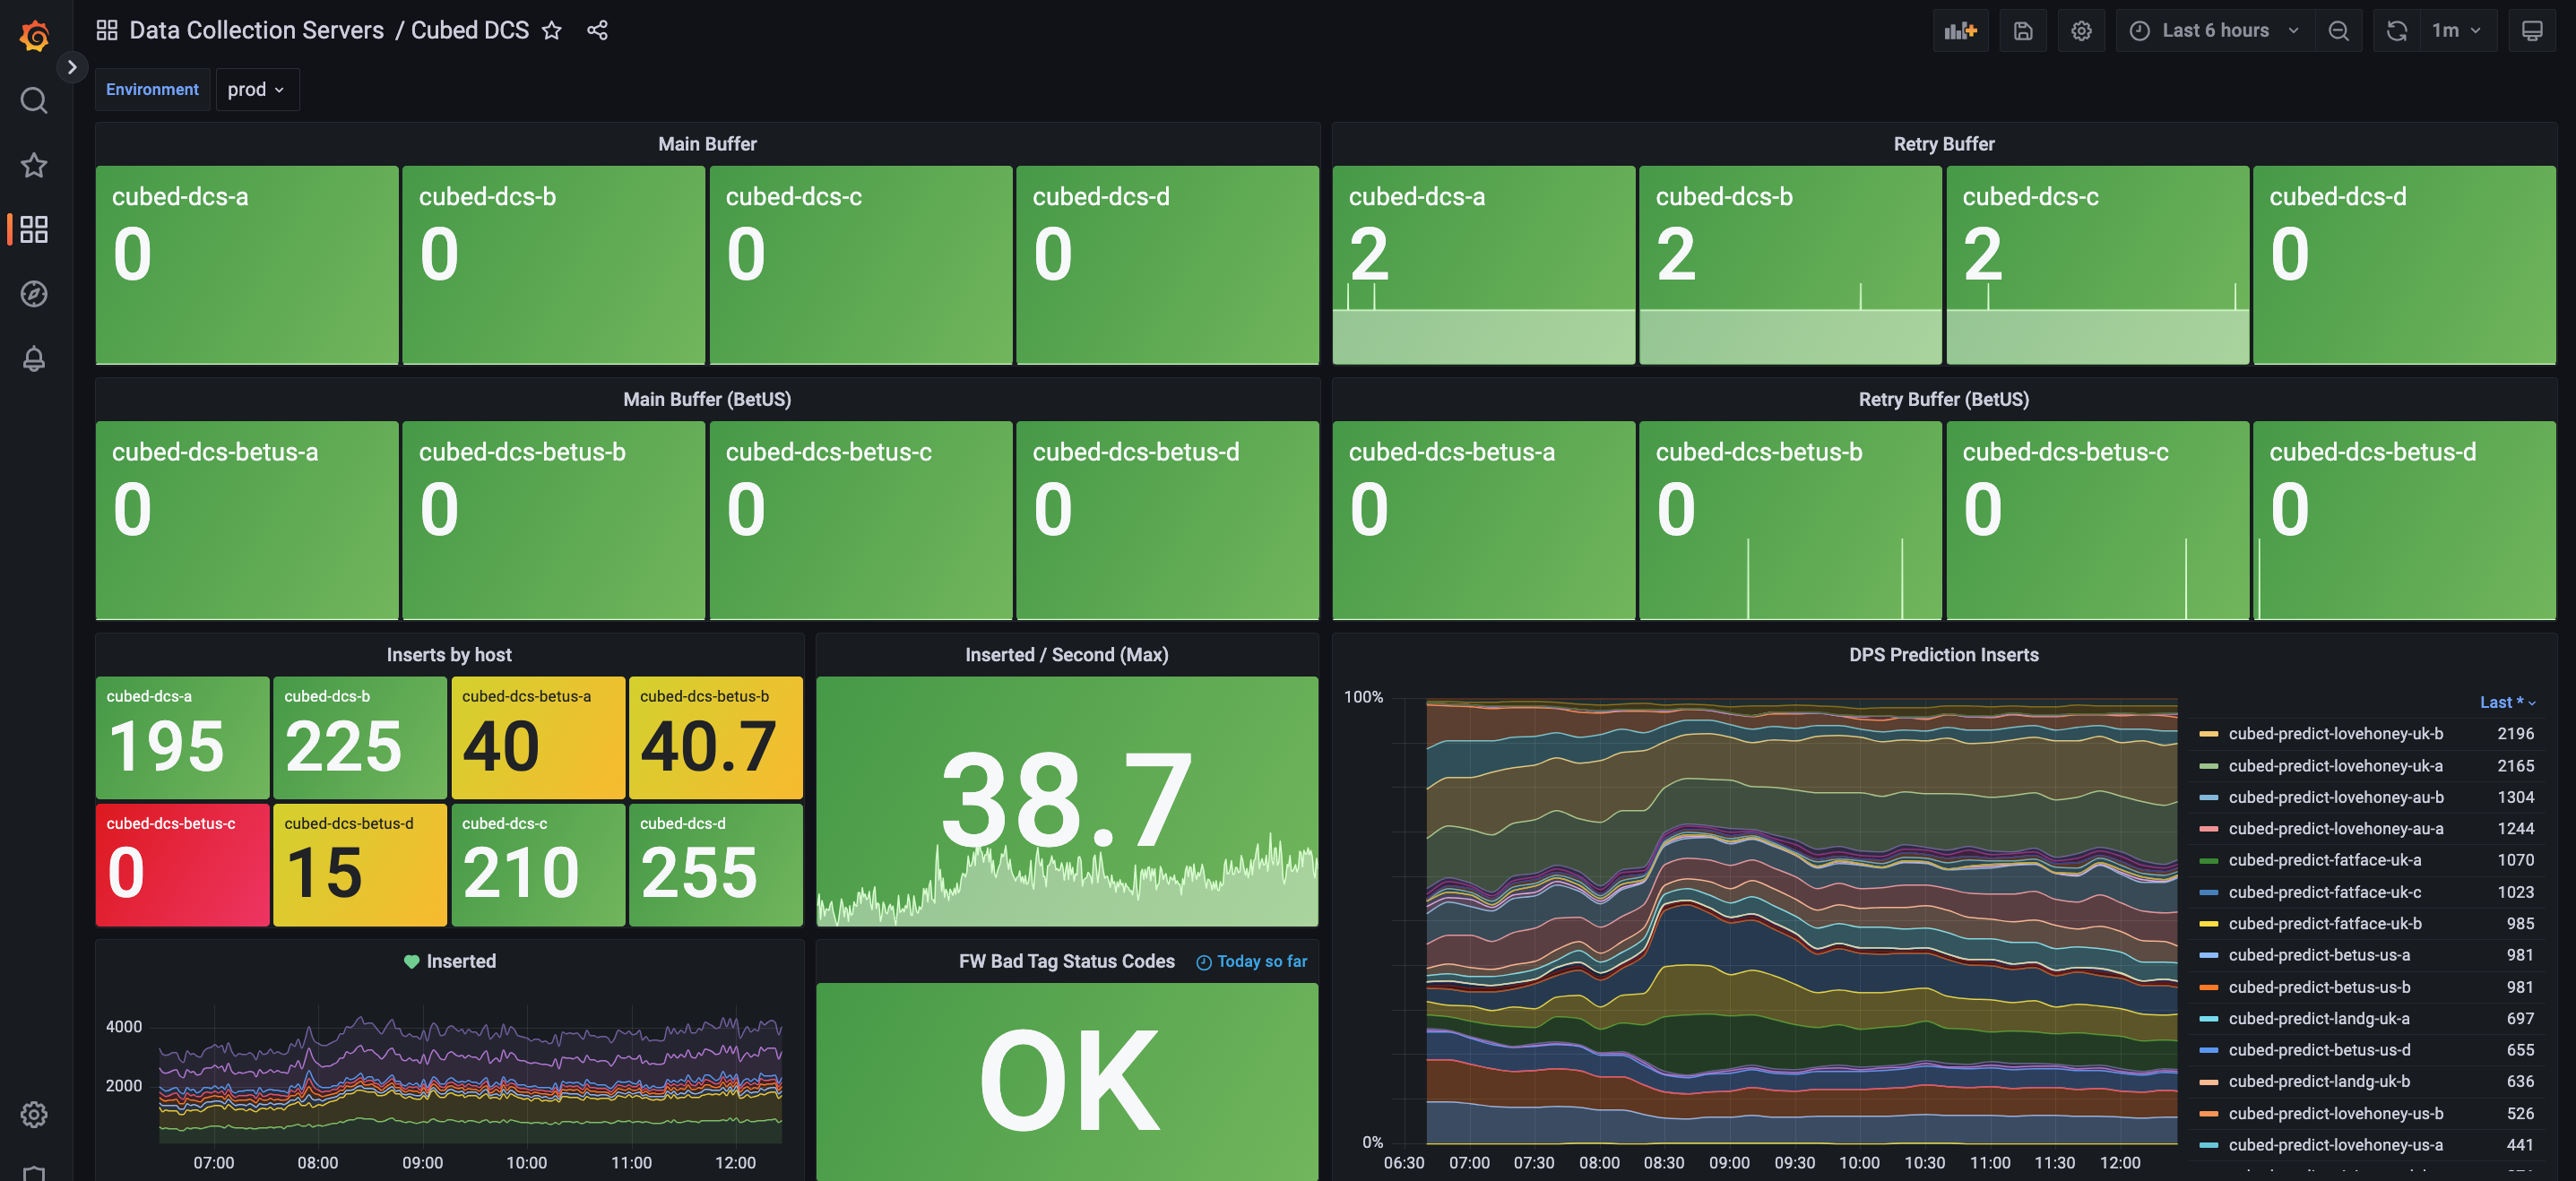
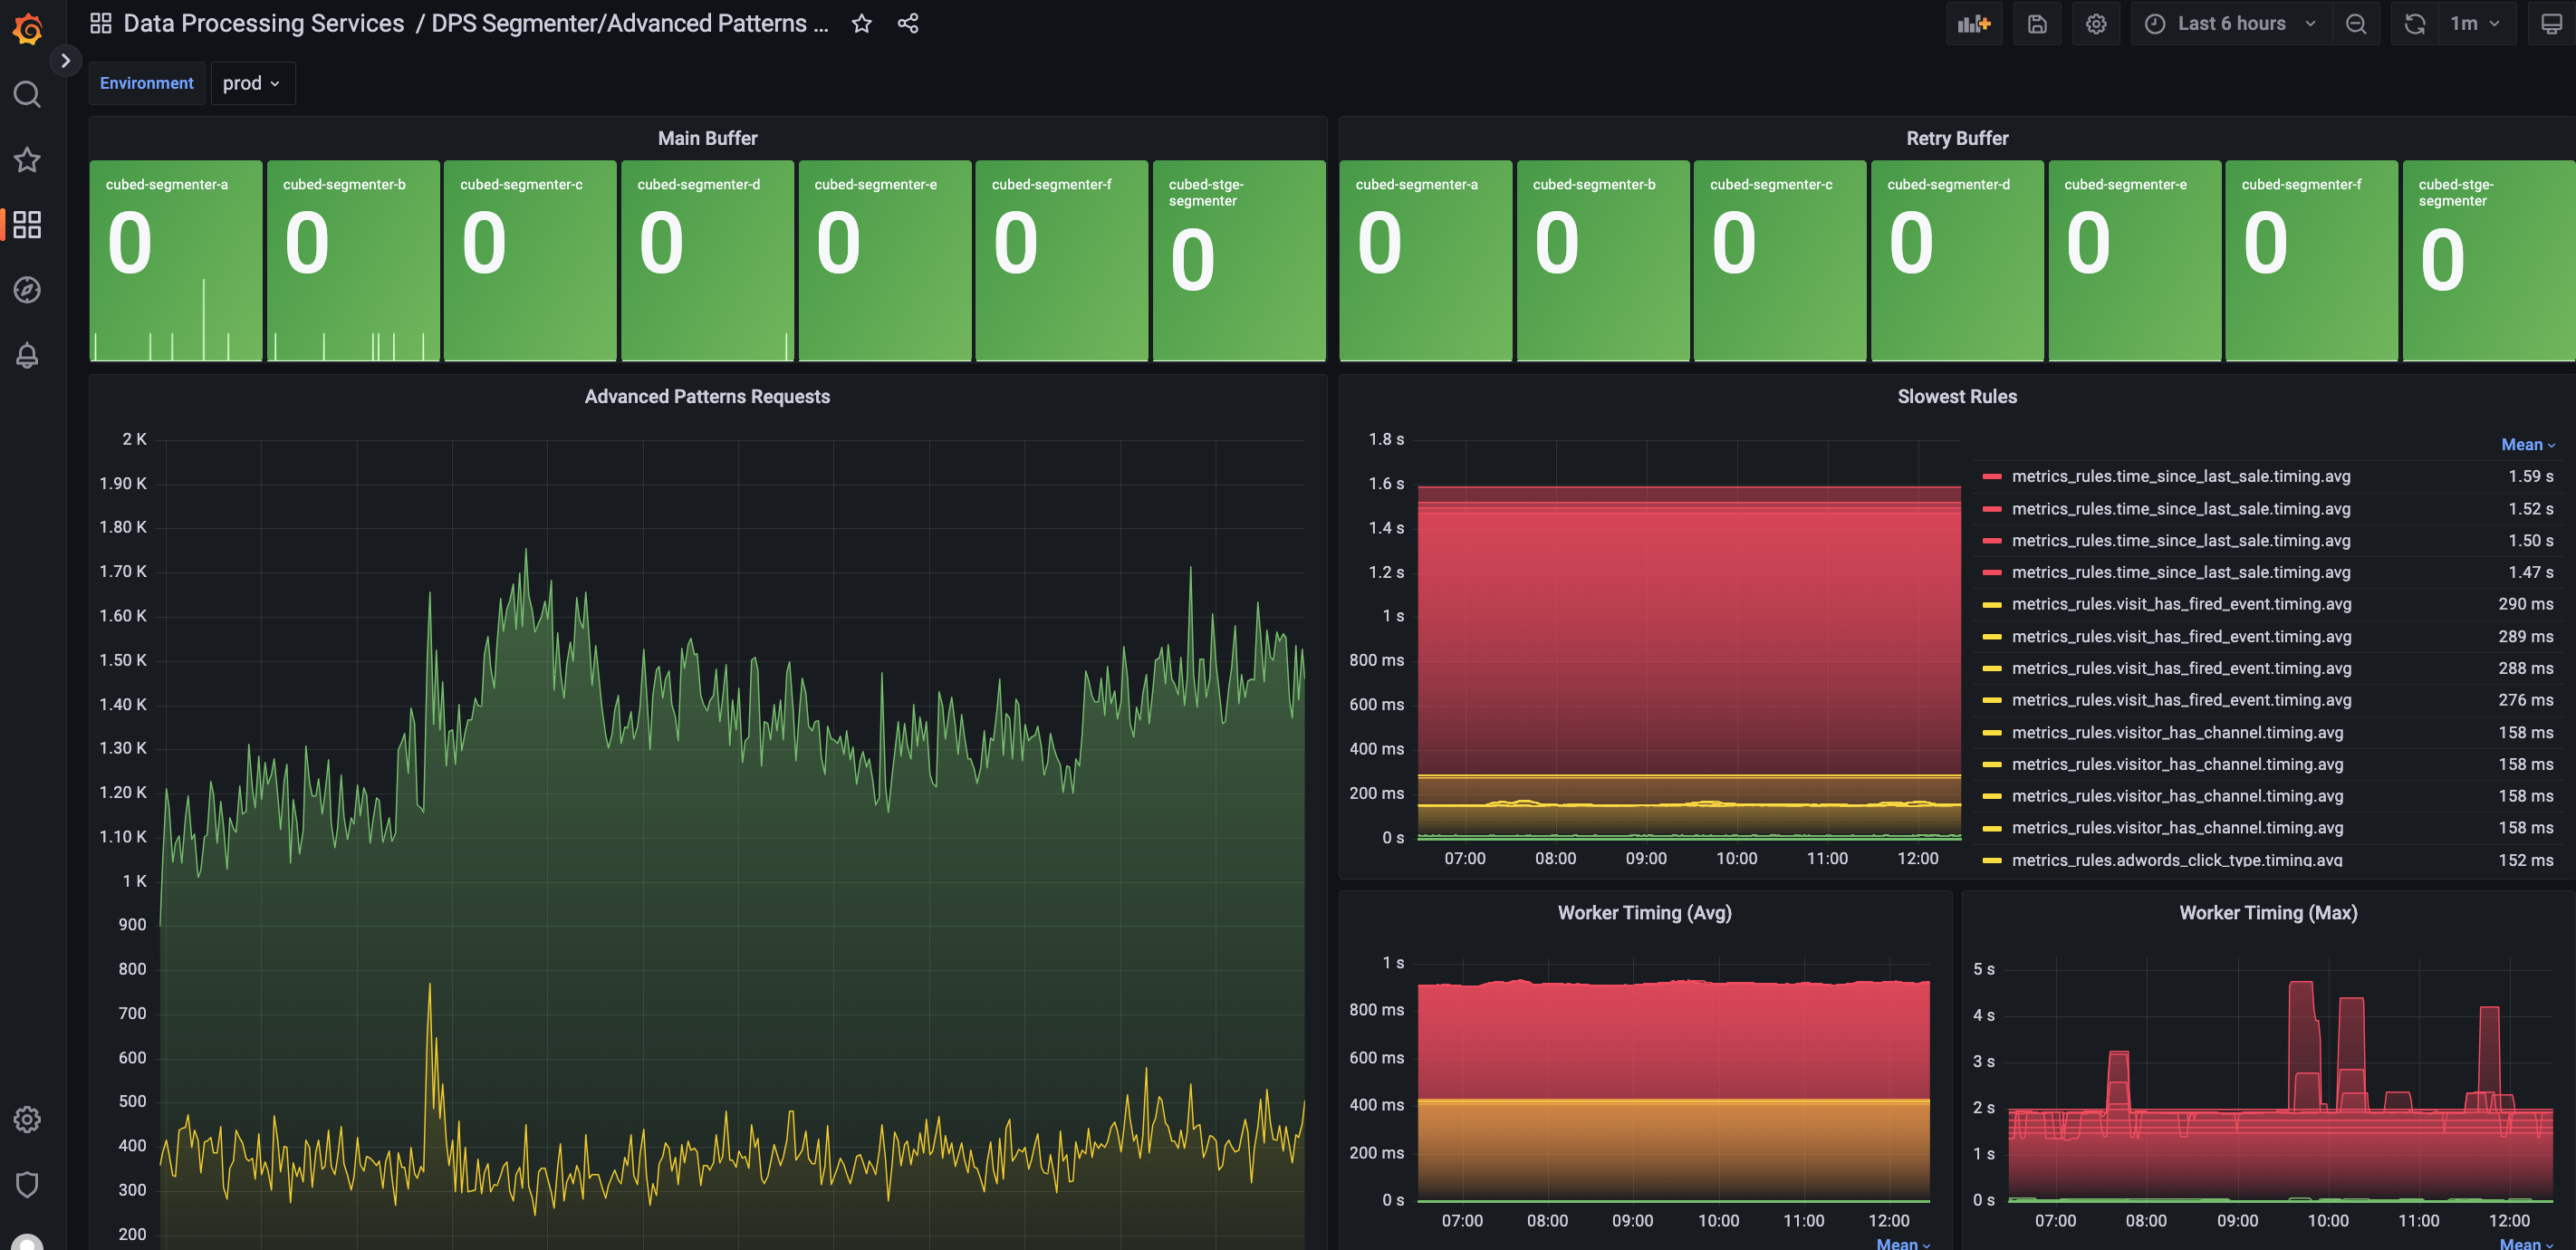
Positive Internet setup grafana for us, so we could have full control over our metric and logging data collection. We have grafana dashboards for monitoring performance and buffers, for systems such as Conductor (command), DPS (Segmenter/Visscore), DCS & SEOPT.
Grana Dashboard Examples


How It Works
There is an Influx DB to store all the metric data, and Loki which scrapes files.
Positive setup telegraf agents to run that talk to specific end points, for example on the dcs and dps they look at /@server which returns a JSON of the state of the server (including workers, buffers etc.). This is scraped every 15 seconds, and is what is used to report on.
Loki is configured to point at files on servers, and read them (line by line in real time) and updates itself. It does not index, so it leaves a small data footprint. The developers wanted to make it behave similar to using grep on linux, which might sound scary to some but once you get used to just the basics, you will find it easy enough to trawl through logs on any box.
Dashboards
We have already configured dashboards for most of the important parts of our system, such as DCS, DPS, Conductor (command) and SEOPT. In the side menu of grafana if you click the Dashboard and then click Browse, it will take you to our custom build dashboards.
Adding graphics
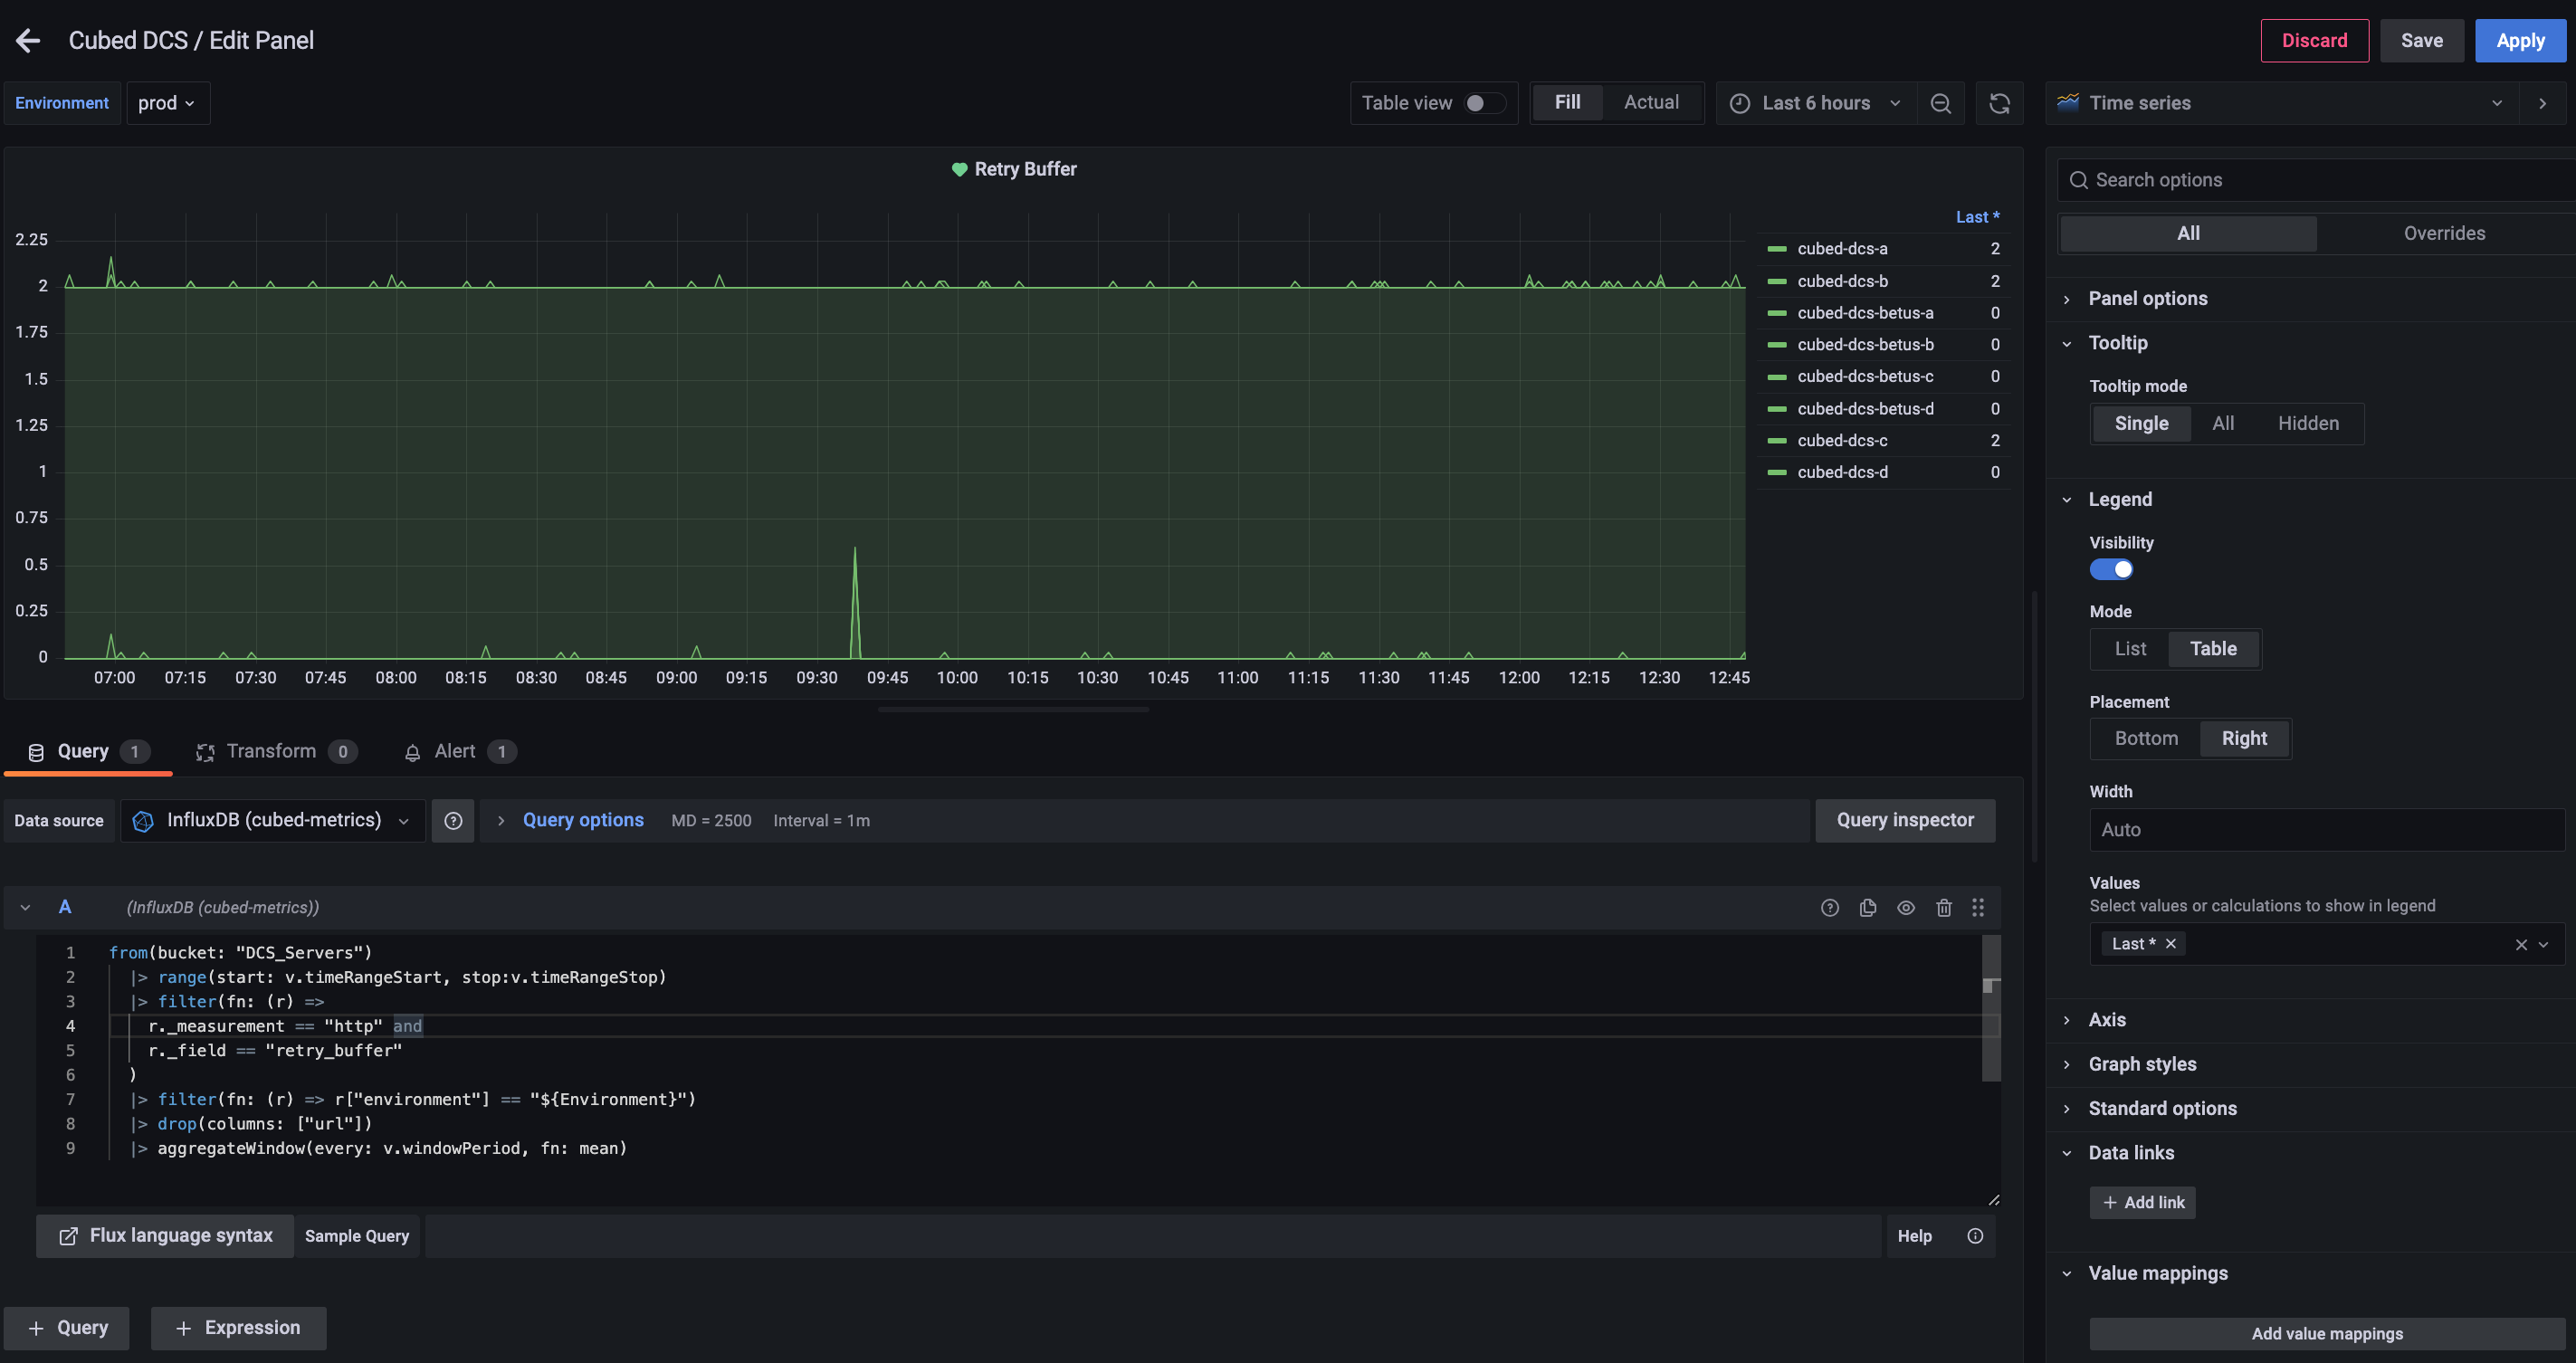
To build influx graphs into existing dashboards, use the Add pannel -> Add a new pannel (top-right) button. Everything is context sensitive, so if in the first drop down you pick environment = production, the next drop downs will only give me items that are available under that. If you then pick service name = dcs, it will limit to just the files Loki is looking on the DCS in Prod. A neat trick is to copy the Sample Query code from another graphic and amend it to your needs.

Filtering on Logs
To look and filter on logs, use Explore. In the side menu of grafana if you click the compass icon Explore, the first thing to do is click the drop down to pick a data source (top left, next to the Explore title). I go to Loki, then start "filtering" for what I want.
Advancements
We've recently updated our 'informational' endpoints on the dps/dcs such as @health, @accounts, @workers and @server. The idea of these is you can request GET them and they return the state of different parts of the boxes. If we're scraping each DCS /@account for example, we could then create a table in grafana to read from those. We would need to work with Positive on giving it the correct bucket_name so we'd know which data source to read from to set this set up.